Cymatics Lab
An interactive audio lab for exploring frequency, resonance, and harmony through eleven visualizations and full track analysis.
1 / 3
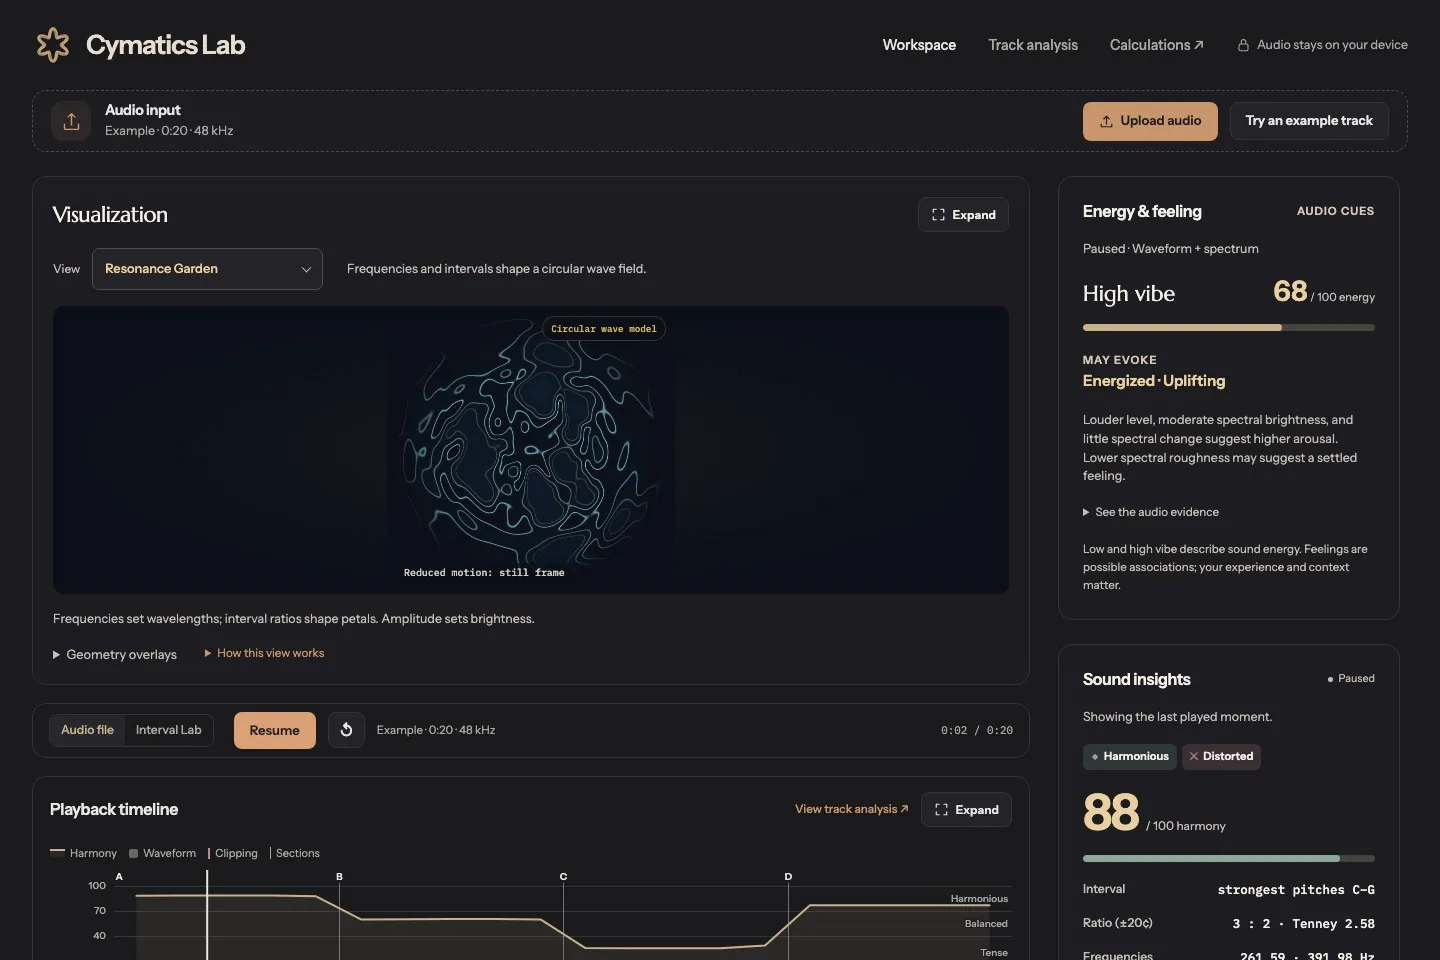
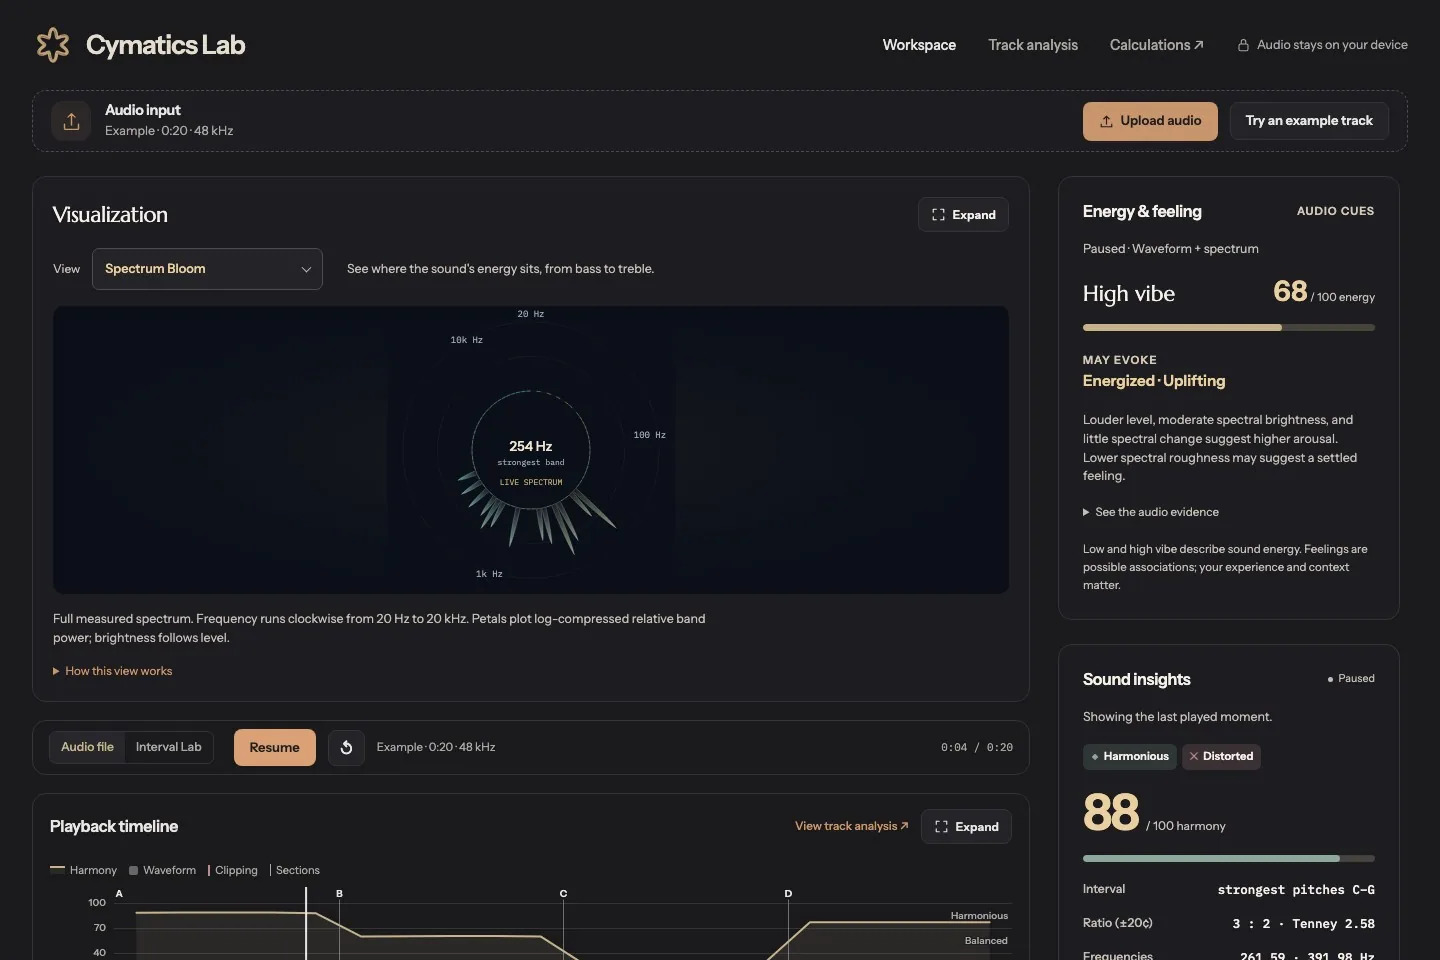
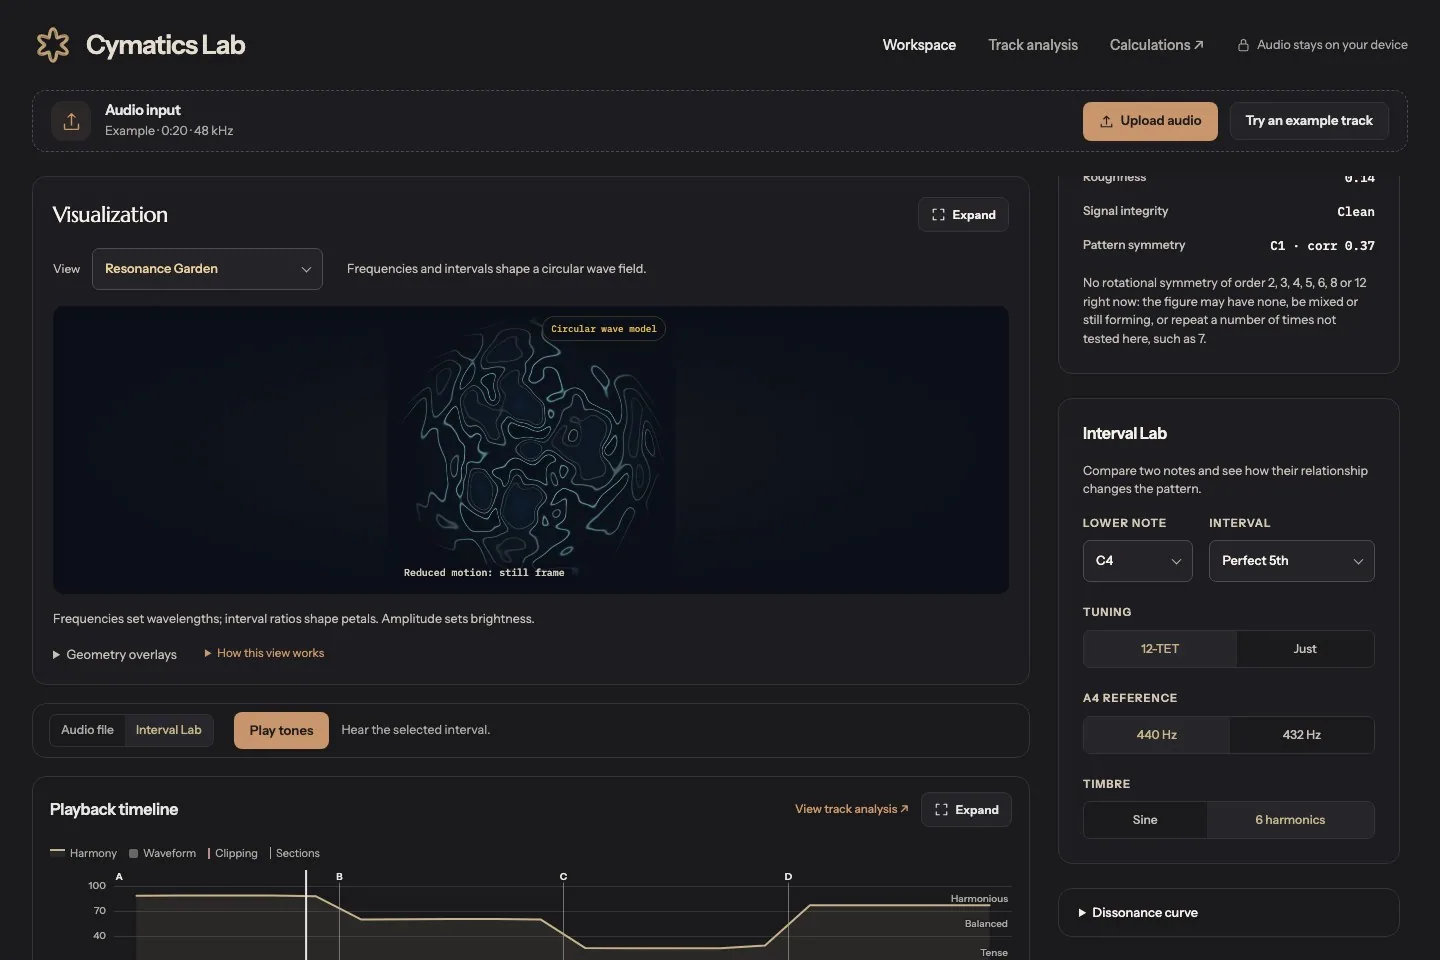
The challenge
Audio measurements can be difficult to interpret without a visual connection. Cymatics turns sound into explorable patterns while keeping the underlying calculations and their limits visible.
The approach
The browser lab maps measured audio to a documented wave field. WebGL2 draws the Resonance Garden when available, with a CPU fallback. Playback position drives the visualization, and a Tauri application packages the lab for local desktop use.
- Browser audio analysis and playback
- WebGL2 field rendering with CPU fallback
- Documented mapping and calibration
- Tauri macOS packaging and product website
The outcome
The local project includes the interactive lab, a field guide, a macOS wrapper, and a product website. The current audio processing runs in the browser; a future Rust DSP backend remains a separate plan.
What I learned
A compelling visualization is more useful when people can inspect how its signals are calculated and understand what those signals do not measure.